Improving our Android app's startup time by 20%
How Baseline Profiles helped the Todoist phone and Wear OS apps get faster easily
By Afzal Najam
In his excellent Android Dev Summit ’22 talk about Baseline Profiles, Rahul Ravikumar convinced me to adopt them and reap the benefits. In the process, we also set up Macrobenchmark to measure the performance of our apps. For the most part, it was as easy to do as I thought, but throwing our Wear OS app into the mix added a few complications.
What are Baseline Profiles?
A baseline profile is a file containing a list of classes and methods downloaded alongside your app when you install it from the Google Play Store. It is then used to compile those classes and methods ahead of time, resulting in startup, frame timing, and general performance improvements.
Ahead-of-time compilation was introduced back in Android 5.0 (Lollipop), but before Baseline Profiles, there were always caveats with each strategy:
- Complete ahead-of-time compilation took up too much installation time and disk space, since all methods and classes were compiled ahead of time.
- Profile Guided Optimization had poor first launch performance and was specific only to the installed device and app version (since Android 7.0 with ART ).
- Play Cloud Profiles alone can take weeks to collect and generate an aggregated profile. It also requires profile regeneration with each app version (since Android 9.0).
The talk from Android Dev Summit ’22 mentioned earlier is a must-watch to learn about the history and trade-offs of these strategies!
So what’s new?
Well, with this new way of creating Baseline Profiles, these caveats are no longer applicable because now, you, the developer, can ship a profile with the app from day 1. We tried this for the Todoist app last month and the results certainly put a smile on our faces.
The improvements
We have two Android apps for Todoist , the phone/tablet app and the Wear OS app. We measured the time to initial display (the startup time), duration of each frame (frame duration), and time by which a given frame missed its deadline (frame overrun time). Frame overrun time is available from API 31+ (Android 12), but the Google Pixel Watch runs Android 11, so we weren’t able to measure it for the Wear OS app.
We used the very useful Benchart tool to convert the benchmark results into a much more readable format, and further verified our results using the Google Spreadsheet template from Py’s blog post on Statistically Rigorous Android Macrobenchmarks .
Startup time
Left: Without Baseline Profiles, Right: With Baseline Profiles
For the Todoist phone app, we saw a median improvement of about 23% in startup time, shaving off 328ms. The maximum startup time for the build with Baseline Profile was less than the minimum time of the build without it, ensuring a faster startup no matter what.

✅ min : After performed 20.6% better (-283.05ms)
✅ median : After performed 22.95% better (-328.05ms)
✅ max : After performed 27.94% better (-436.4ms)Left: Without Baseline Profiles, Right: With Baseline Profiles
At almost 14%, the improvement for the Wear OS app wasn’t as drastic, but we were still able to save about 267 ms in the median startup time. Now, our worst startup time is better than the times most users were previously experiencing!

✅ min : After performed 19.96% better (-364.9ms)
✅ median : After performed 13.94% better (-267.7ms)
✅ max : After performed 8.5% better (-173.85ms)
Frame duration
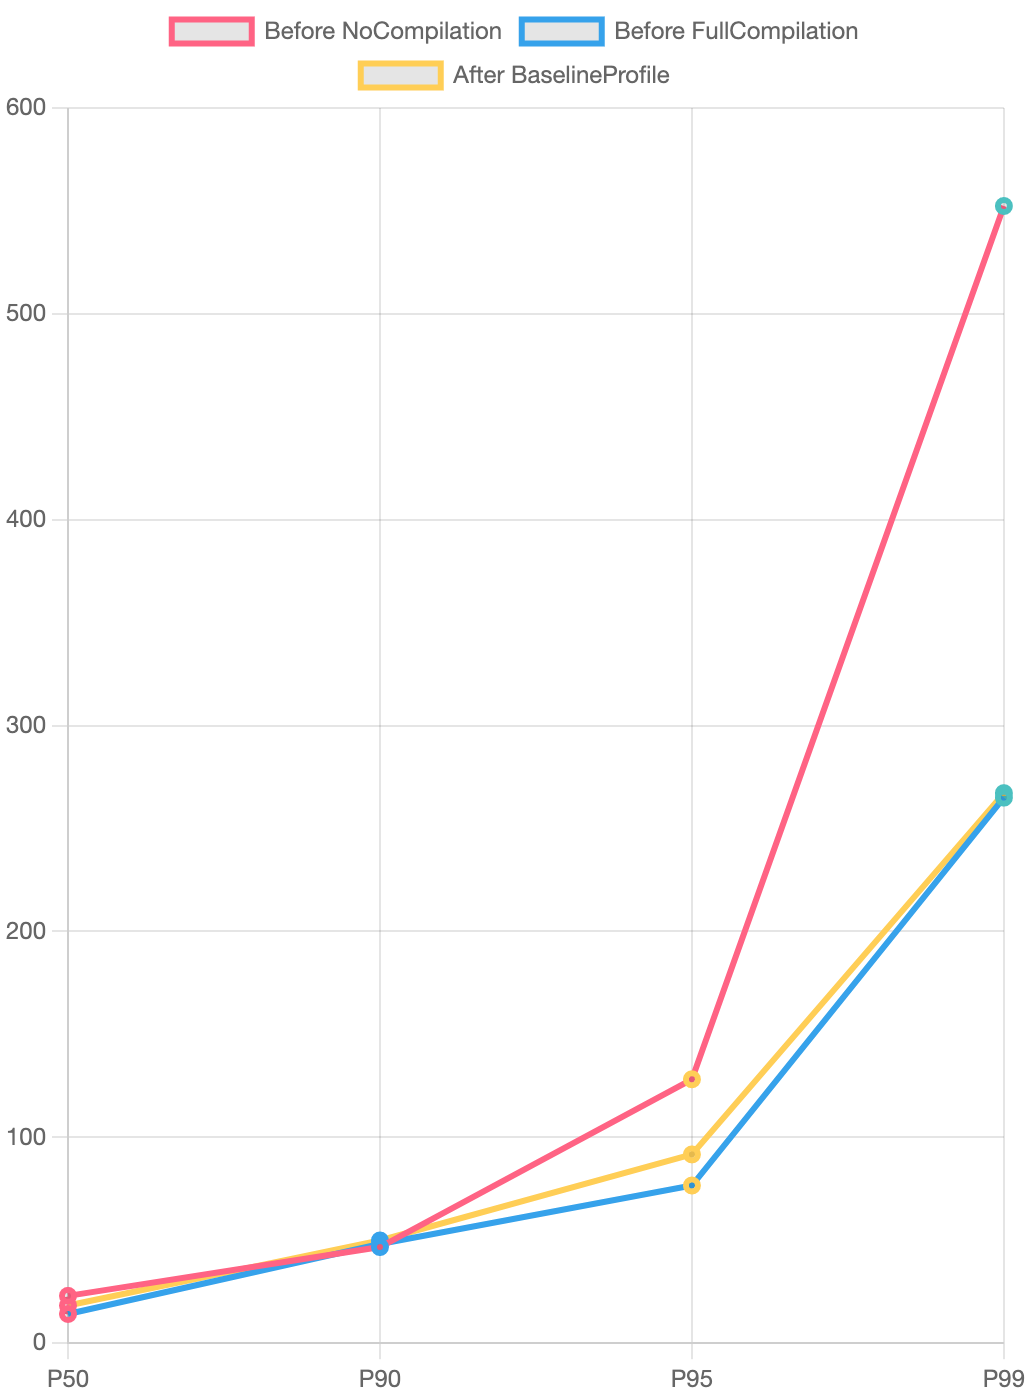
We saw some improvements in frame duration for the Todoist phone app. The longest 95th percentile frames improved by 19.96% (11.15ms) but otherwise the median duration was unnoticeably better.

✅ P50 : After performed 3.38% better (-0.35ms)
✅ P90 : After performed 4.05% better (-1.2ms)
✅ P95 : After performed 19.96% better (-11.15ms)
✅ P99 : After performed 7.22% better (-12.3ms)
On the Wear OS app, we observed a similar level of improvement. The median frame duration only improved by 1.6%, but we saw a significant uptick in the extreme — frames took almost 35% less time in the 99th percentile.
✅ P50 : After performed 1.61% better (-0.3ms)
❌ P90 : After performed 5.16% worse (+2.45ms)
✅ P95 : After performed 10.45% better (-10.7ms)
✅ P99 : After performed 34.62% better (-141.5ms)
Frame overrun time
Android documentation describes frame overrun time as:
How much time a given frame missed its deadline by. Positive numbers indicate a dropped frame and visible jank / stutter, negative numbers indicate how much faster than the deadline a frame was.
If this number is greater than 0, the overall smoothness of the app is affected negatively. Thankfully, in our case the median frame overrun time was already negative and didn’t see much change (only 0.7ms) but even here, we saw improvements for the frames taking too long.

✅ P50 : After performed 2.08% better (-0.1ms)
✅ P90 : After performed 20.53% better (-3.85ms)
✅ P95 : After performed 45.86% better (-34.9ms)
✅ P99 : After performed 3.43% better (-9.05ms)
Implementing it for Todoist and Wear
We have separate modules for the Todoist phone and Wear OS apps. After experimenting with having a single benchmark module for both, we ended up creating a dedicated module for each app to make it simpler to specify the targetProjectPath that Android Test modules require. It was also a better approach to use Macrobenchmark instrumentation arguments for generating a baseline profile from the terminal.
The official documentation to set up a Macrobenchmark module and create Baseline Profiles came in very handy. Since we were already creating a new benchmark build type, it was easy to switch the network environment for these benchmarks to our staging server in that build type. This was very useful because, on the phone, we’re going through the sign-up, onboarding, and new task user flows.
For structuring the tests, we used the Robot pattern .
We also found that using collectStableBaselineProfile with a maxIterations of 7 for both apps yielded slightly better results for startup time than just using collectBaselineProfile.
Creating Baseline Profiles and measuring the performance on the phone app was straight-forward for the most part. The Wear OS app came with some challenges, though.
Challenges
Wear OS emulator on Apple Silicon
The phone app uses Gradle Managed Devices to generate the profile using a headless emulator. However, the Wear app needs a manually launched emulator, since there is no support for Wear Gradle Managed Devices yet.
Yet another challenge with generating Baseline Profiles on a Wear OS emulator is that it doesn’t work if the host machine is an M1 Mac. This is a reported issue . Our workaround was to use a separate x86 computer to host the Wear OS emulator, using a technique described in How to use Android’s x86 emulators on M1 Macs .
Typing with UI Automator on Wear OS
Typing on Wear OS is different from the phone. When you want to prompt the user to type something, you send an Intent with android.support.wearable.input.action.REMOTE_INPUT action and the system shows these screens.

So we need to find these Views without having their IDs, including the keyboard. It turns out that the content description of the keyboard button is Keyboard, of course. For typing itself, we have to find the EditText using a By.clazz selector, and finally to tap the “send” button, we need to use the Send content description. Here’s what that looks like in code:
fun submitText(text: String) {
    val device = UiDevice.getInstance(InstrumentationRegistry.getInstrumentation())
    device.findObject(By.descContains("Keyboard")).click()

    val editText = device.findObject(By.clazz("android.widget.EditText"))
    editText.text = text
    device.findObject(By.descContains("Send")).click()
}
Running benchmarks on a Google Pixel watch
While the above issues were with the emulator, the benchmark was also very flaky on my Google Pixel watch, even when it was working perfectly on the emulator. Here are some ways to avoid that.
- Enable the “Stay awake when charging” option in Developer Options.
- Account for accidental double-taps. There might be times when a previous click goes through as a double-tap and UI Automator isn’t able to find the element you’re looking for anymore. Allowing the test to continue if some UI elements aren’t found made it more resilient for us.
Running benchmarks over Wi-Fi
Wireless debugging did not work very well for running the benchmark on the phone, due to connection drops, whereas wired debugging worked perfectly.
When to update Baseline Profiles
While work is ongoing to add support for CI, it isn’t strictly necessary to generate Baseline Profiles very often. Since the profile contains a list of classes and methods, unless there’s some refactor or new screens in the signup, onboarding, or the main content screen, there won’t be a significant difference in performance.
For now, we have decided to generate them manually at every release, but only if necessary based on the changes. In the future, we plan to run it automatically in CI.
Future
Baseline Profiles pushed us to start measuring our performance using the Macrobenchmark library. Now that we have that set up, we can work towards continuously monitoring the performance of our apps.
In the future, we’d like to set up an automated pipeline that stores the benchmark results from the last update, generates a new baseline, runs benchmarks, and compiles a comparison of the benchmark results between releases. There’s a sample from Google showing exactly how to do it using GitHub Actions and Firebase Test Lab, so it’s just a matter of time.